Network Properties & NFX Canvas
Assess the seven properties of the relationship underlying the network, and match tactics to them
The problem this canvas solves
Network effects depend on the nature of the relationship underlying the experience - not on generic notions of network topology. The Network Properties & NFX Canvas assesses the seven key properties of that relationship - supply commoditization vs differentiation, symmetry vs asymmetry, location (local/regional/global), single vs multi-tenancy, transaction frequency and lifetime, transaction value, monogamy vs polygamy - and how they shape network-effect behavior.
When to use it
Use the canvas to classify each key relationship along the seven properties, sketch the expected shape of the network-effect curve (slowdowns and plateaus included), and place the Growth Tactics cards that fit those properties. It works together with the Growth Tactics Cards and the Growth Tactics Cheat Sheet.
The canvas
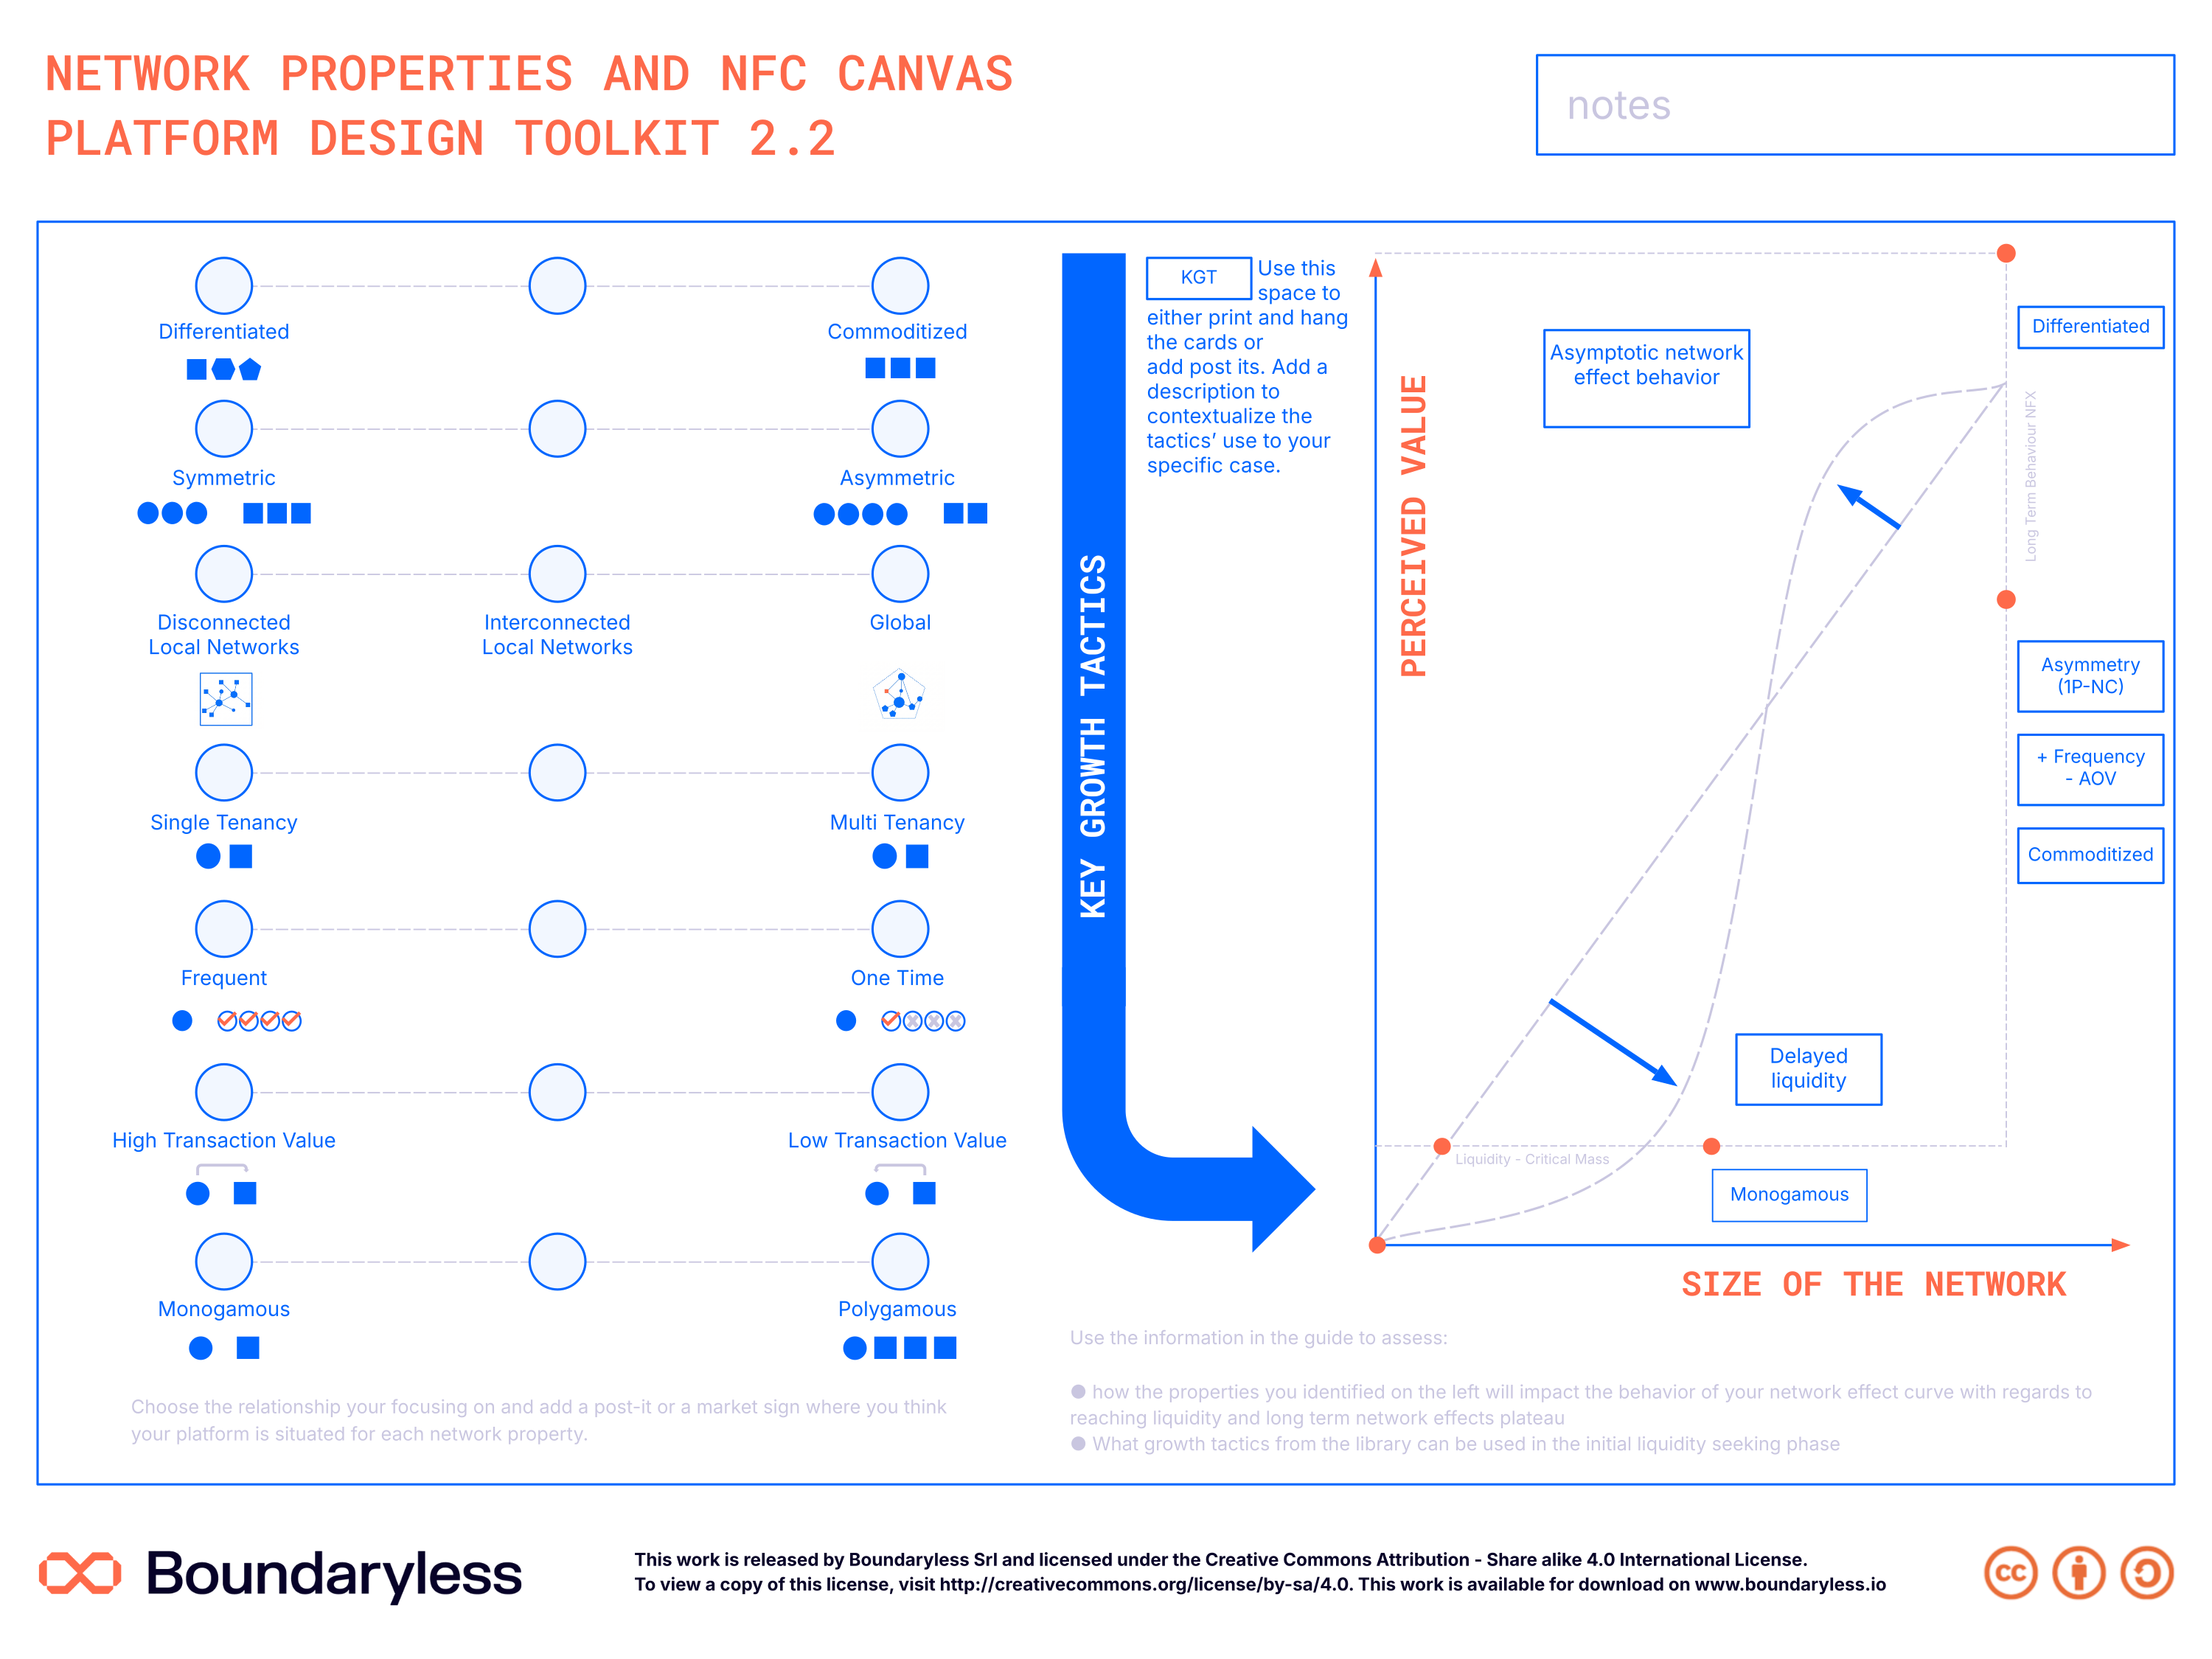
The canvas in the updated Boundaryless brand (full resolution — click to zoom). A print-ready PDF and editable SVG are also available on request.
Canvas structure
Property set (seven properties)
Spectrums where you mark what characterizes your core supply-demand relationship: supply commoditization/differentiation, symmetry/asymmetry, location flexibility, single/multi-tenancy, transaction frequency and lifetime, transaction value, monogamous/polygamous.
Network-effects shape sketch
The area where you sketch the expected shape of your network-effect curve (typically an S-curve), reflecting how the properties slow liquidity or make effects plateau.
Growth tactics zone
The dedicated zone where you stick the Growth Tactics Cards representing the tactics you want to use.
How to use it
Assess the basic properties of the relationship underlying your network and use them to evaluate how your network-effect curve will play out - not all networks are equal, and the properties shape both your path to liquidity and long-term defensibility.
Steps
- Setup — Identify the relationship you're assessing - start from the Platform Experience, centered on a specific supply-demand relationship (an Airbnb host and a guest). One relationship at a time.
- Property set — Fill the property set first - assess the seven properties, marking the position that characterizes your relationship on each spectrum.
- Curve sketch — Sketch the expected network-effect curve, assessing how each property affects it: slowing the acquisition of liquidity, or making effects plateau (asymptotic effects, e.g. ride-hailing beyond a 2-minute pickup).
- Tactics zone — Once the shape is set, use the Growth Tactics Cheat Sheet to match tactics to your property polarities, and stick the chosen cards in the dedicated space.
Tips
- Always do the property assessment first, before sketching the curve or picking tactics.
- On post-its, always describe in text why you chose a certain positioning - the context will help later.
- Take the property-impact breakdown with a grain of salt: all networks are different.
- The properties belong to the relationship, not the platform - they can be analyzed at any stage.
- What you end up with: a synthetic understanding of how the network effects will behave and how the properties impact your liquidity challenge - with candidate tactics attached.
Connections with other canvases
Feeds into
- Flywheel Sketching Canvas — Network effects power flywheels
- Platform Design Canvas — Network properties inform design
Informed by
- Ecosystem Canvas — Ecosystem structure determines network topology
Complements
- Learning Engine Canvas — Learning and network effects compound
Used in techniques
Used in pipelines
Related reading
- Launching Platforms: Growth Hacking & Network Effects — Deep dive on types of network effects and how to leverage them
Resources
- Guide reference: PDT Growth & Product Guide - Network Properties chapter
- License: Creative Commons Attribution - Share Alike 4.0 International
- Version: 2.2
Canvas · Part of Platform Design Toolkit · v2.2