Ecosystem Scan Canvas
Map the ecosystem of entities, relationships, and value flows
The problem this canvas solves
The Ecosystem Scan builds a common understanding of all the current behaviors and experiences available in the ecosystem, by mapping its components along the three layers of the market (Cicero's triangle): long-tail markets (niche producers and consumers), aggregators (mediators and brokers), and infrastructures (enabling elements and commodities).
When to use it
Use the Ecosystem Scan to visualize the ecosystem signals inside a chosen arena: map the entities, brokers/mediators, and leveraged resources into the three layers. Opportunity identification comes in the following steps - leverageable assets and moats, then the Wardley Map and the Six Platform Plays.
The canvas
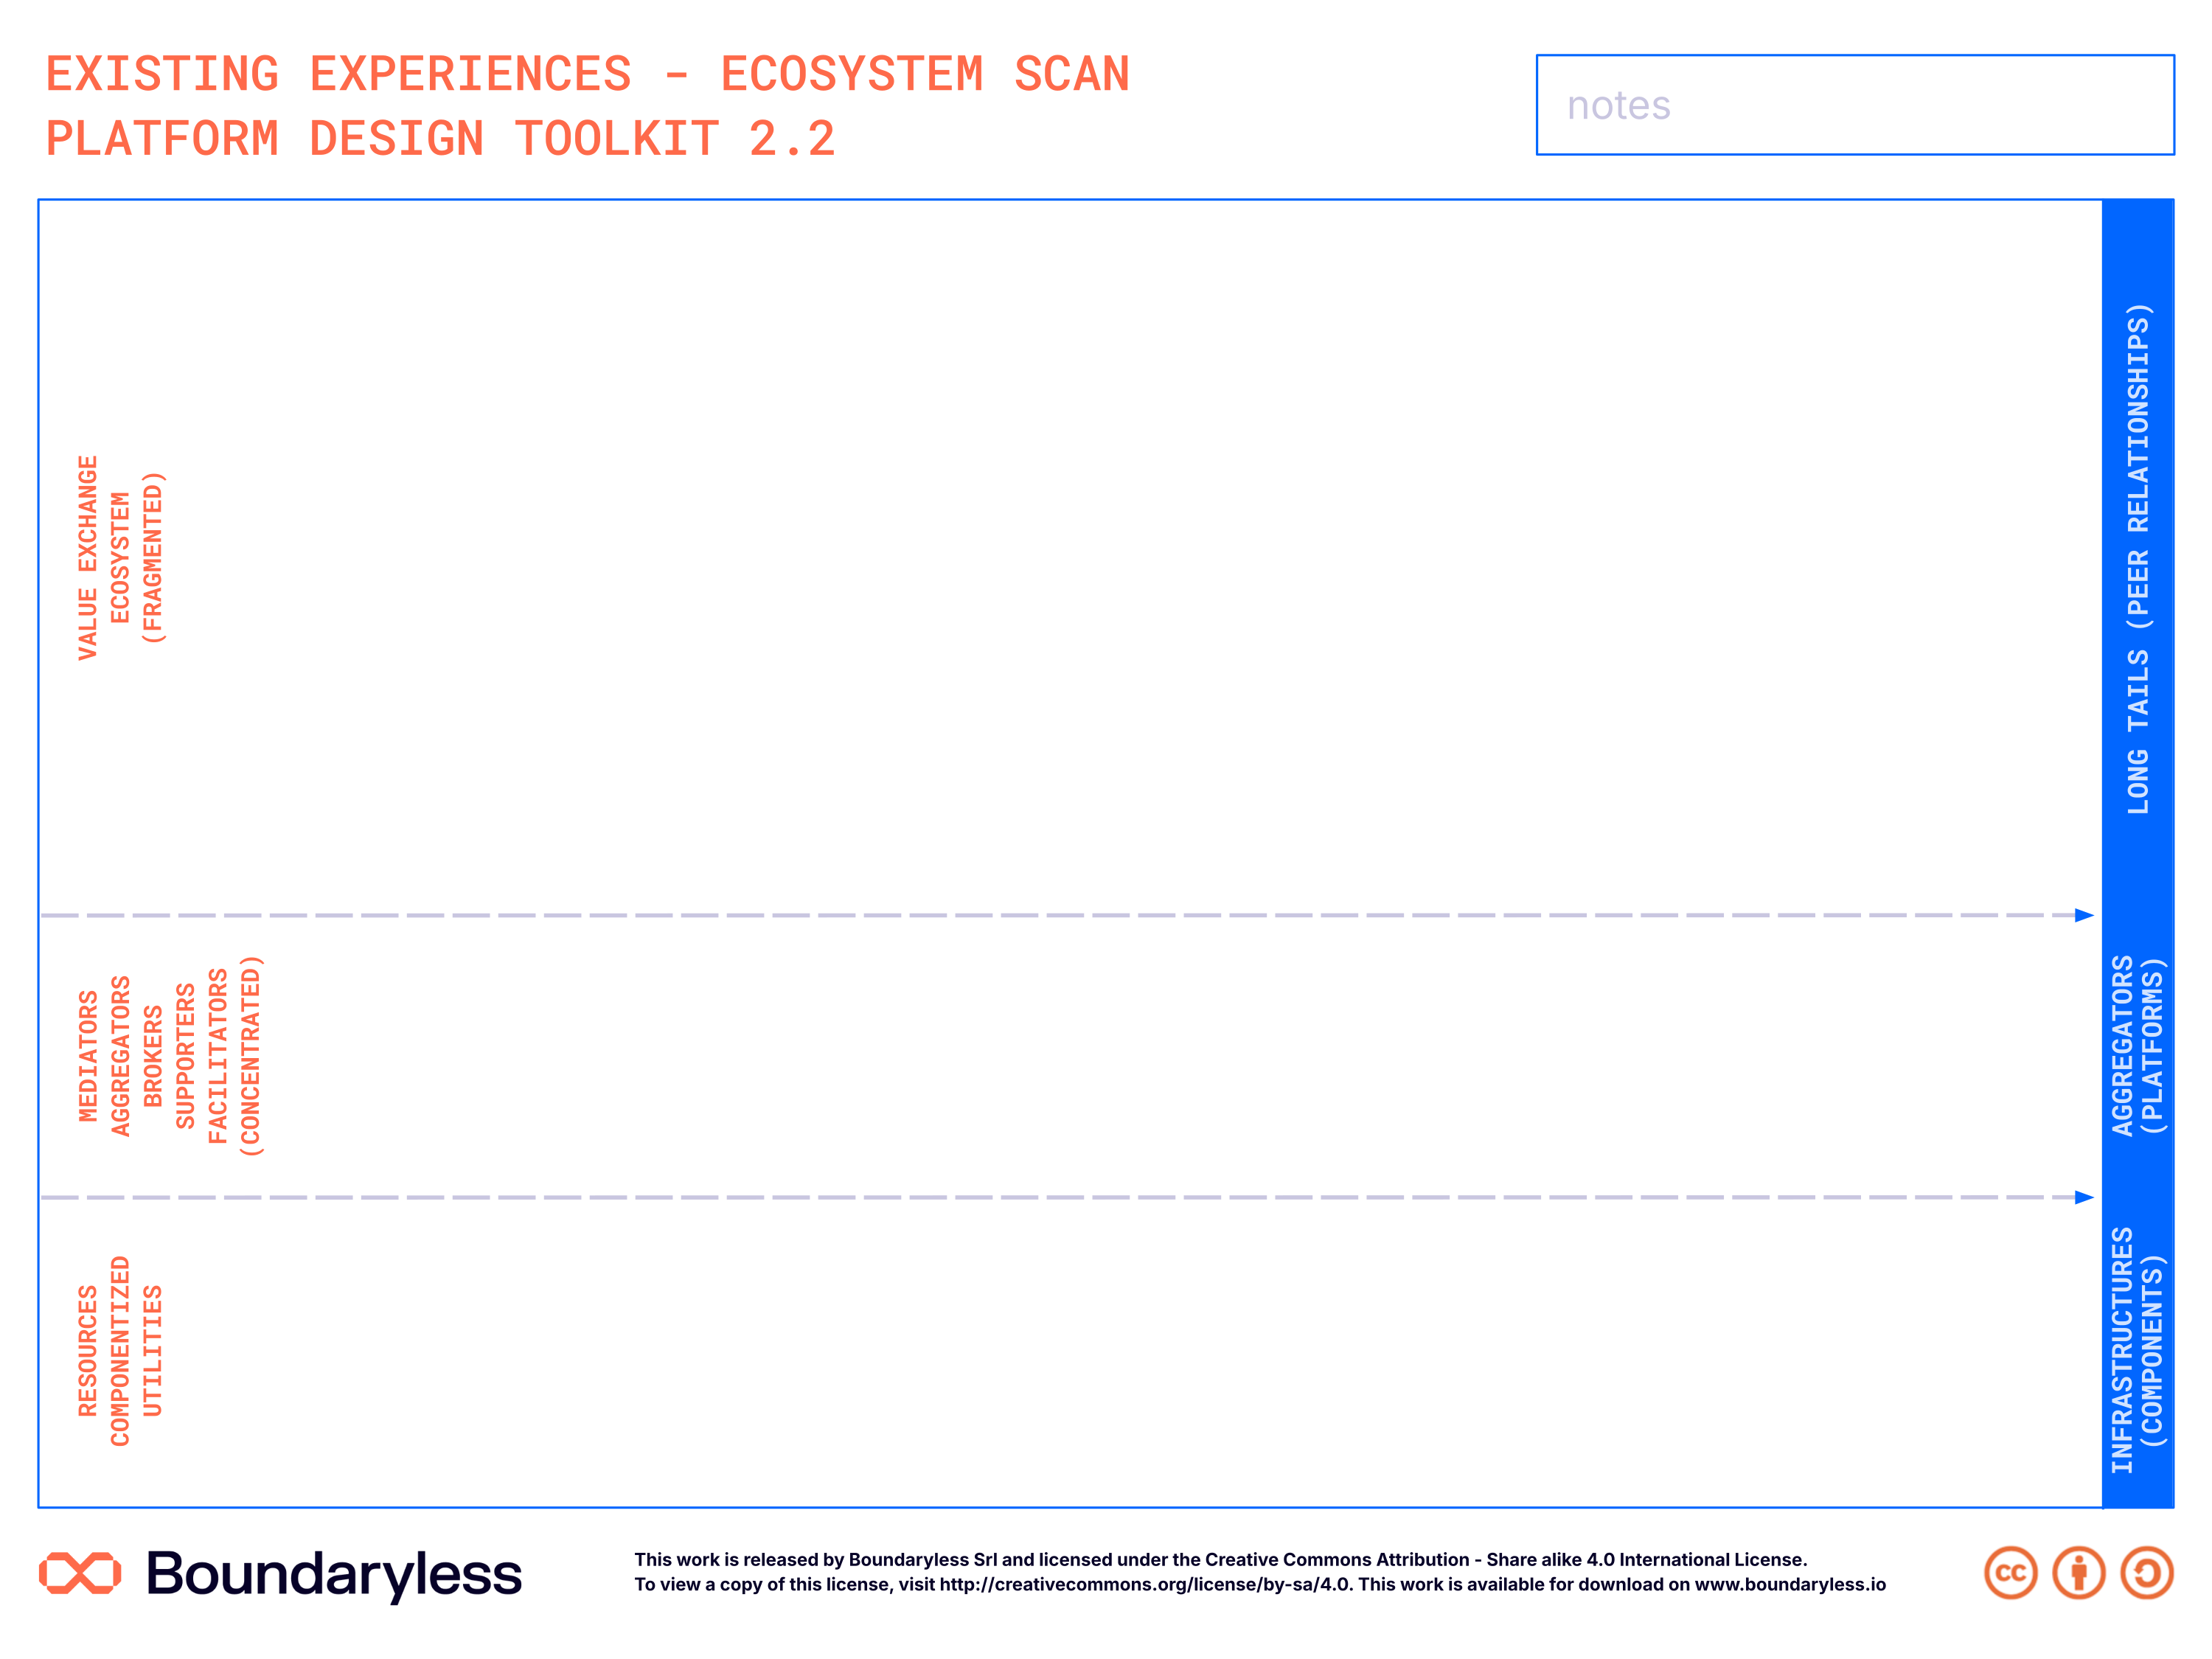
The canvas in the updated Boundaryless brand (full resolution — click to zoom). A print-ready PDF and editable SVG are also available on request.
Canvas structure
Long Tail Markets (top layer)
Where producers and consumers of value find their natural place - niches of entities exchanging value that the aggregator will support.
Aggregators / Platforms (middle layer)
Entities currently playing 'trusted advisor' and 'talent agent' roles - mediators, brokers, facilitators - that a platform strategy could supersede.
Infrastructures (bottom layer)
Price-sensitive elements, modules and consumable products used to create new propositions - candidates for consolidation and economies of scale.
Assets & moats overlays
Moats mark dominant players (established aggregators, regulated/permissioned players); leverageable assets mark where your VRIO-qualified assets sit.
How to use it
The team visualizes the ecosystem's signals - current behaviors and experiences - mapping all entities and elements along the layered market abstraction of Cicero's triangle; positions change very frequently at the beginning.
Steps
- Setup — Use a tool that lets you reposition elements easily (sticky notes, collaborative whiteboard) - you will move things around a lot at the start.
- All layers — Enumerate the most important experiences (by frequency, value) happening among the most relevant entities or roles; add post-its and connect them as you see interactions.
- All layers — For each element ask: does it sit at the top (small peer seeking personalized solutions), in the middle (already mediating/brokering), or below (utilities, building blocks)?
- Long Tail Markets — Label the clusters of actions or experiences to help define arenas - one arena is a set of jobs-to-be-done clusters showing coherence.
- Assets & moats — Identify the moats (established demand/supply sources, regulated players), then position your VRIO-qualified assets near the related elements in the right layer.
Tips
- Do the scanning after getting 'out of the building' - at least a round of open-ended interviews with ecosystem representatives - or have them participate in the mapping.
- If the context is new to you, consult a domain expert to optimize the learning curve, and validate the mapped elements with a replicable interview script.
- To spot moats, seek alternative routes enabling the same value flows - if none exist, a solid moat is most likely there.
- Don't try to replace the moats (you won't out-Google Google) - ask instead how to facilitate and streamline the interaction with them.
- What you end up with: a clear view of the ecosystem's contexts of interaction, entities and layers, enriched with assets and moats - the basis for choosing the arena.
Connections with other canvases
Feeds into
- Brief Consolidation Canvas — Ecosystem map informs brief
- Ecosystem Canvas — Scan informs designed ecosystem
Informed by
- Arena Scan Canvas — Arena context guides ecosystem mapping
Complements
- Entity Portrait Canvas — Portrait details entities identified in scan
Used in techniques
Used in pipelines
Related reading
- The Macro-Problems and Techniques of Platform Design — Part of Macro-Problem 1: Understanding Ecosystems to create Value Propositions
Resources
- Guide reference: PDT Opportunity Exploration Guide - Ecosystem Scan chapter
- License: Creative Commons Attribution - Share Alike 4.0 International
- Version: 2.2
Canvas · Part of Platform Design Toolkit · v2.2