Wardley Map Canvas
Map value chain components by evolution stage for strategic positioning
The problem this canvas solves
Static competitive analysis misses how markets evolve. Components that are differentiators today become commodities tomorrow. Organizations invest in building capabilities that should be bought, or buy what they should build. Wardley Maps visualize the value chain from user needs to components, positioned by evolution stage (genesis → custom → product → commodity), revealing strategic moves, build vs. buy decisions, and platform opportunities.
When to use it
Use the Wardley Map to visualize the value chain from user needs through components, positioned by their evolutionary stage (genesis to commodity). This helps identify strategic moves, build vs. buy decisions, and platform opportunities.
The canvas
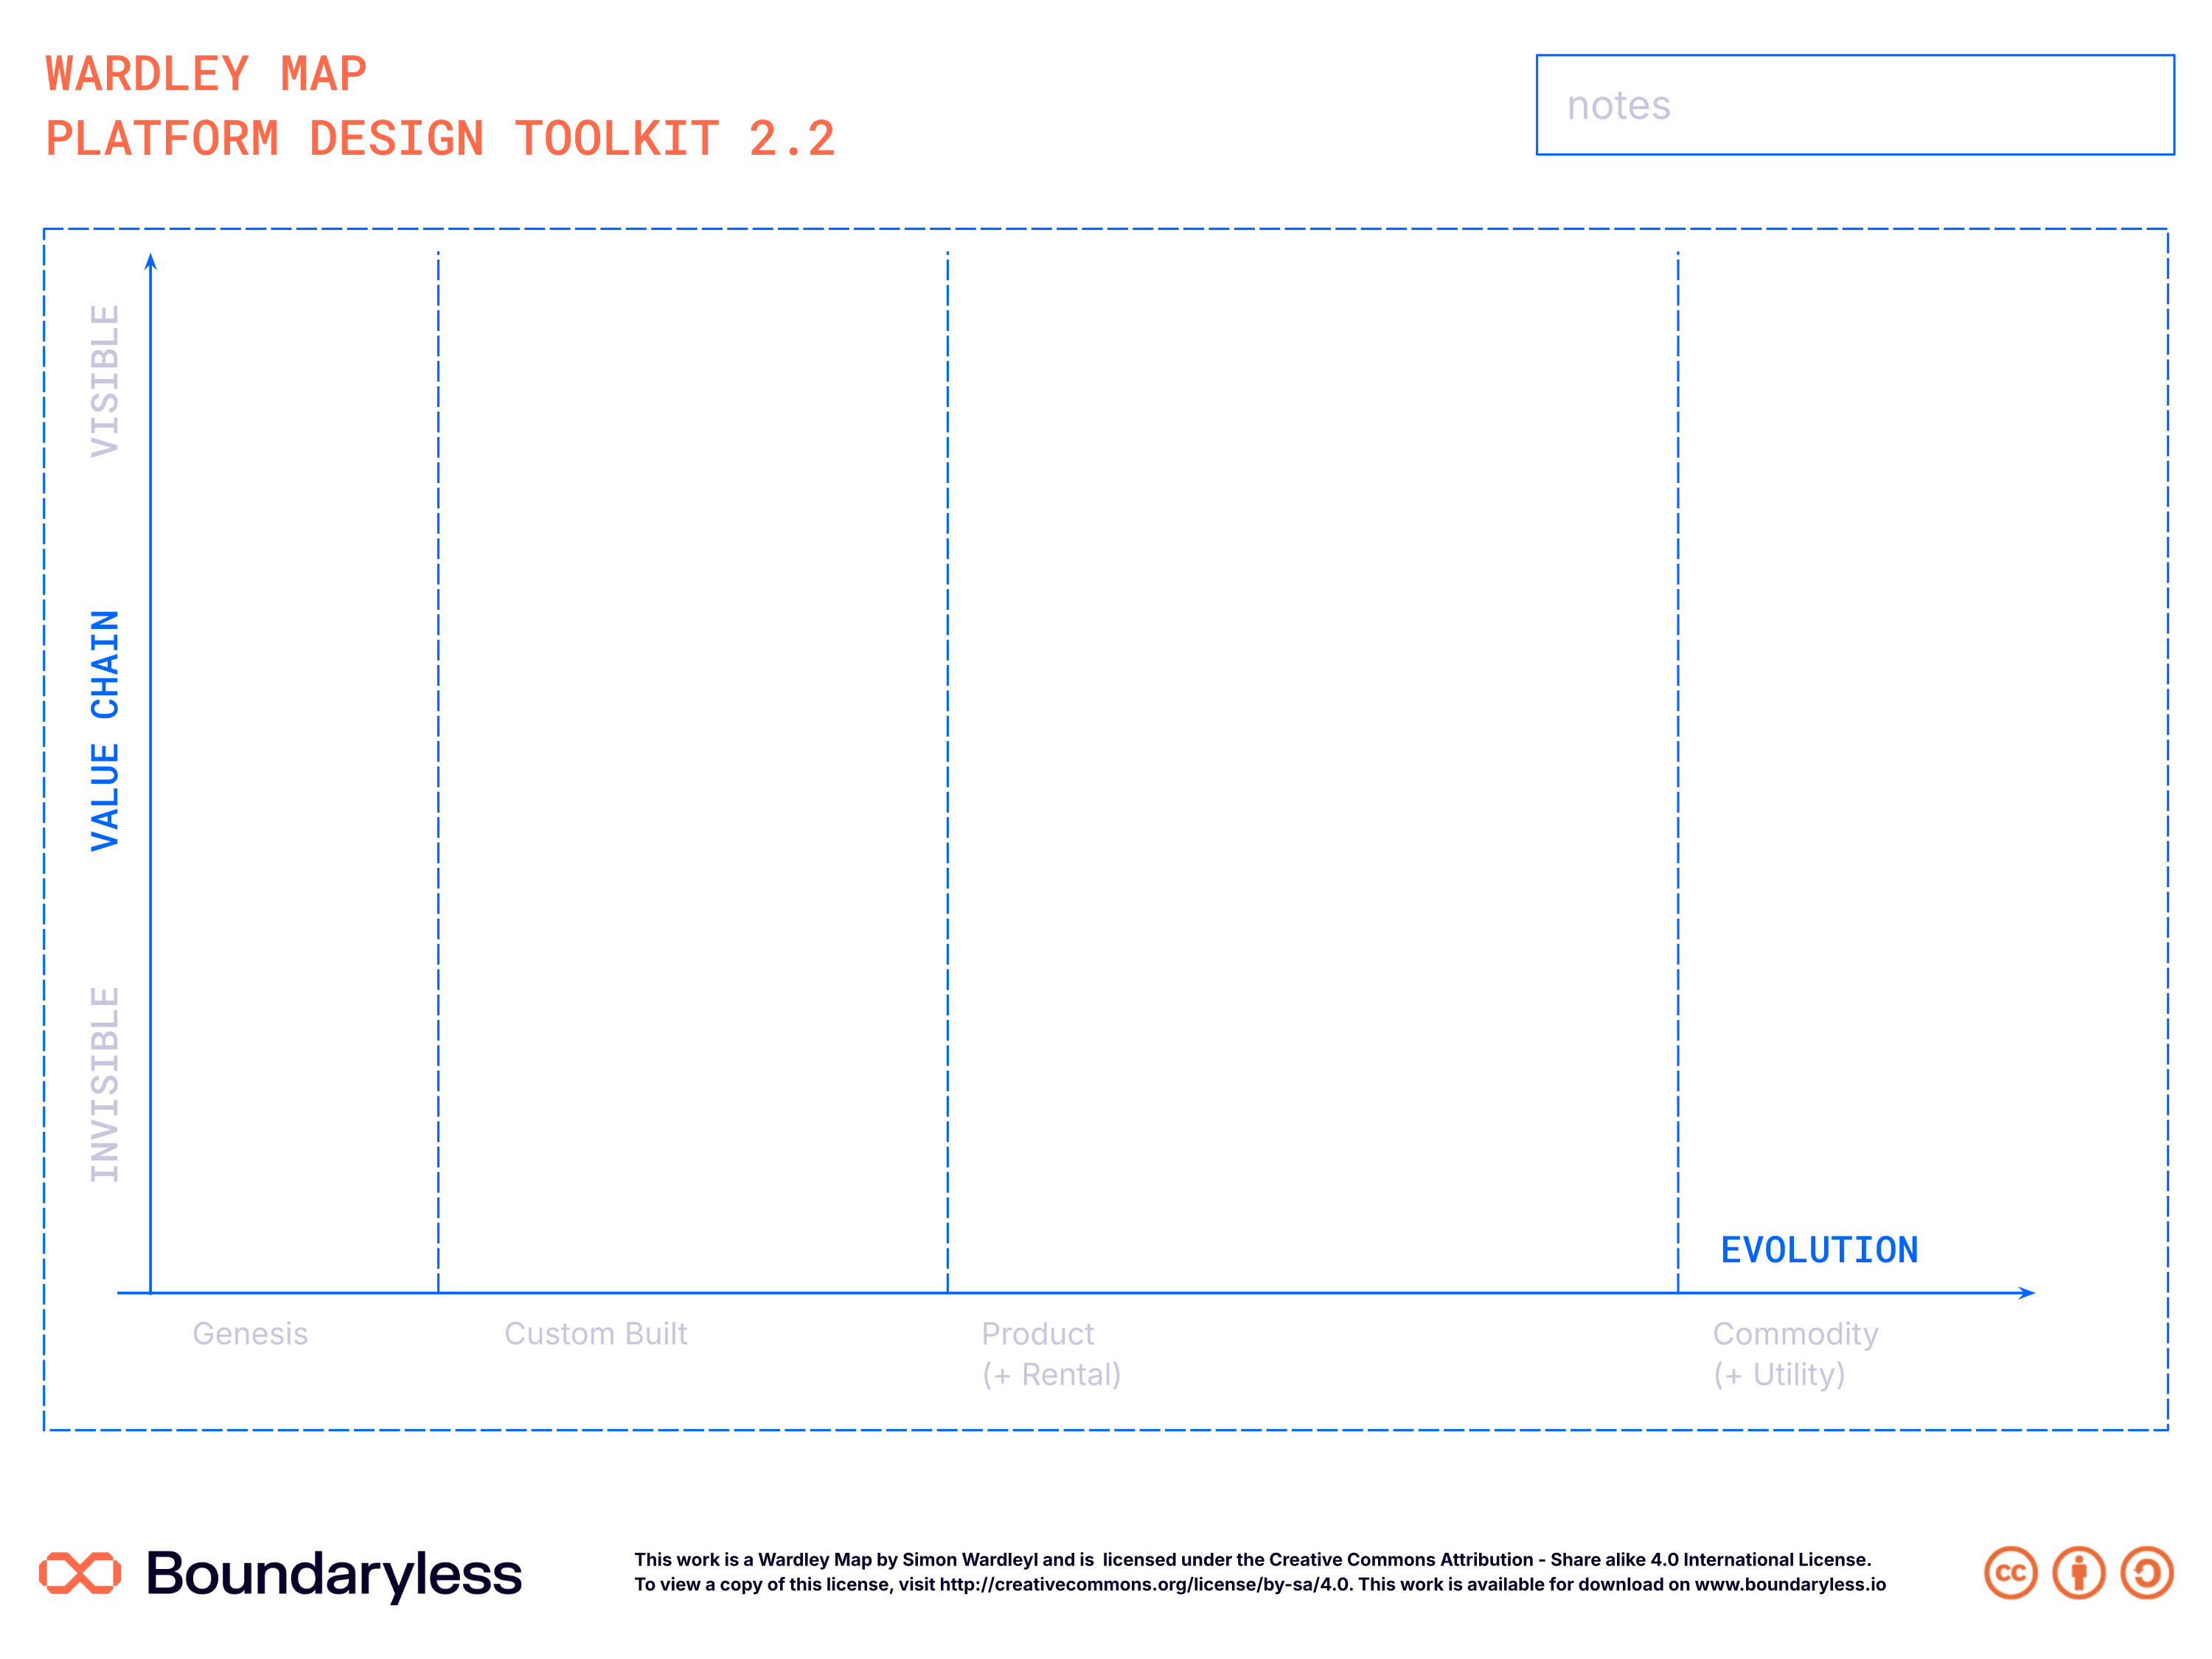
The canvas in the updated Boundaryless brand (full resolution — click to zoom). A print-ready PDF and editable SVG are also available on request.
Connections with other canvases
Feeds into
- Brief Consolidation Canvas — Wardley insights inform strategic brief
- Platform Design Canvas — Evolution stage informs platform positioning
Informed by
- Arena Scan Canvas — Arena context informs component mapping
- VRIO Analysis Canvas — VRIO helps position own capabilities
Complements
- Ecosystem Scan Canvas — Ecosystem and Wardley maps provide complementary views
Used in techniques
Used in pipelines
Related reading
- Apply Value Chain Analysis with Wardley Maps to identify a Platform Opportunity — Step-by-step guide to using Wardley Maps for platform strategy
Resources
- Guide reference: PDT Opportunity Exploration Guide - Wardley Map chapter
- License: Creative Commons Attribution - Share Alike 4.0 International
- Version: 2.2
Part of Platform Design Toolkit · v2.2