Growth Model Canvas
Build a quantitative growth model that connects investments, loops, and metrics through cohort analysis
This canvas is in draft — structure and guidance may still evolve. Use the Growth Model technique page for the operational walk-through.
What this canvas is for
The Growth Model Canvas is a structured way to capture the quantitative model of how a platform grows — connecting investments to outcomes through cohort analysis and the active growth loops. Unlike a strategic canvas you fill in a workshop, the Growth Model Canvas is the visual companion to a spreadsheet model: it captures the mental picture of the system, while the spreadsheet captures the math.
The canvas helps a founder, head of growth, or product leader articulate:
- Which loops are active and how each one feeds new users into the platform
- How cohorts progress through states (New → Activated → Active → Churned)
- What unit economics look like per period and per cohort (LTV, fully loaded CAC, contribution margin)
- Which assumptions are gating breakeven and need experimental validation
The canvas became part of the Boundaryless toolkit as the operational complement to the metrics framework presented in Key Metrics for Platform-Marketplaces and the growth-loops framework presented in the PDT Growth & Product Guide.
When to use it
- Before annual planning — the model is your forecast, scenario planner, and diagnostic in one
- Before fundraising — investors expect a defensible growth model
- When growth has plateaued and you can't pinpoint why — the model surfaces which assumption broke
- When choosing between competing investment hypotheses — sensitivity analysis quantifies the impact of each lever
The canvas
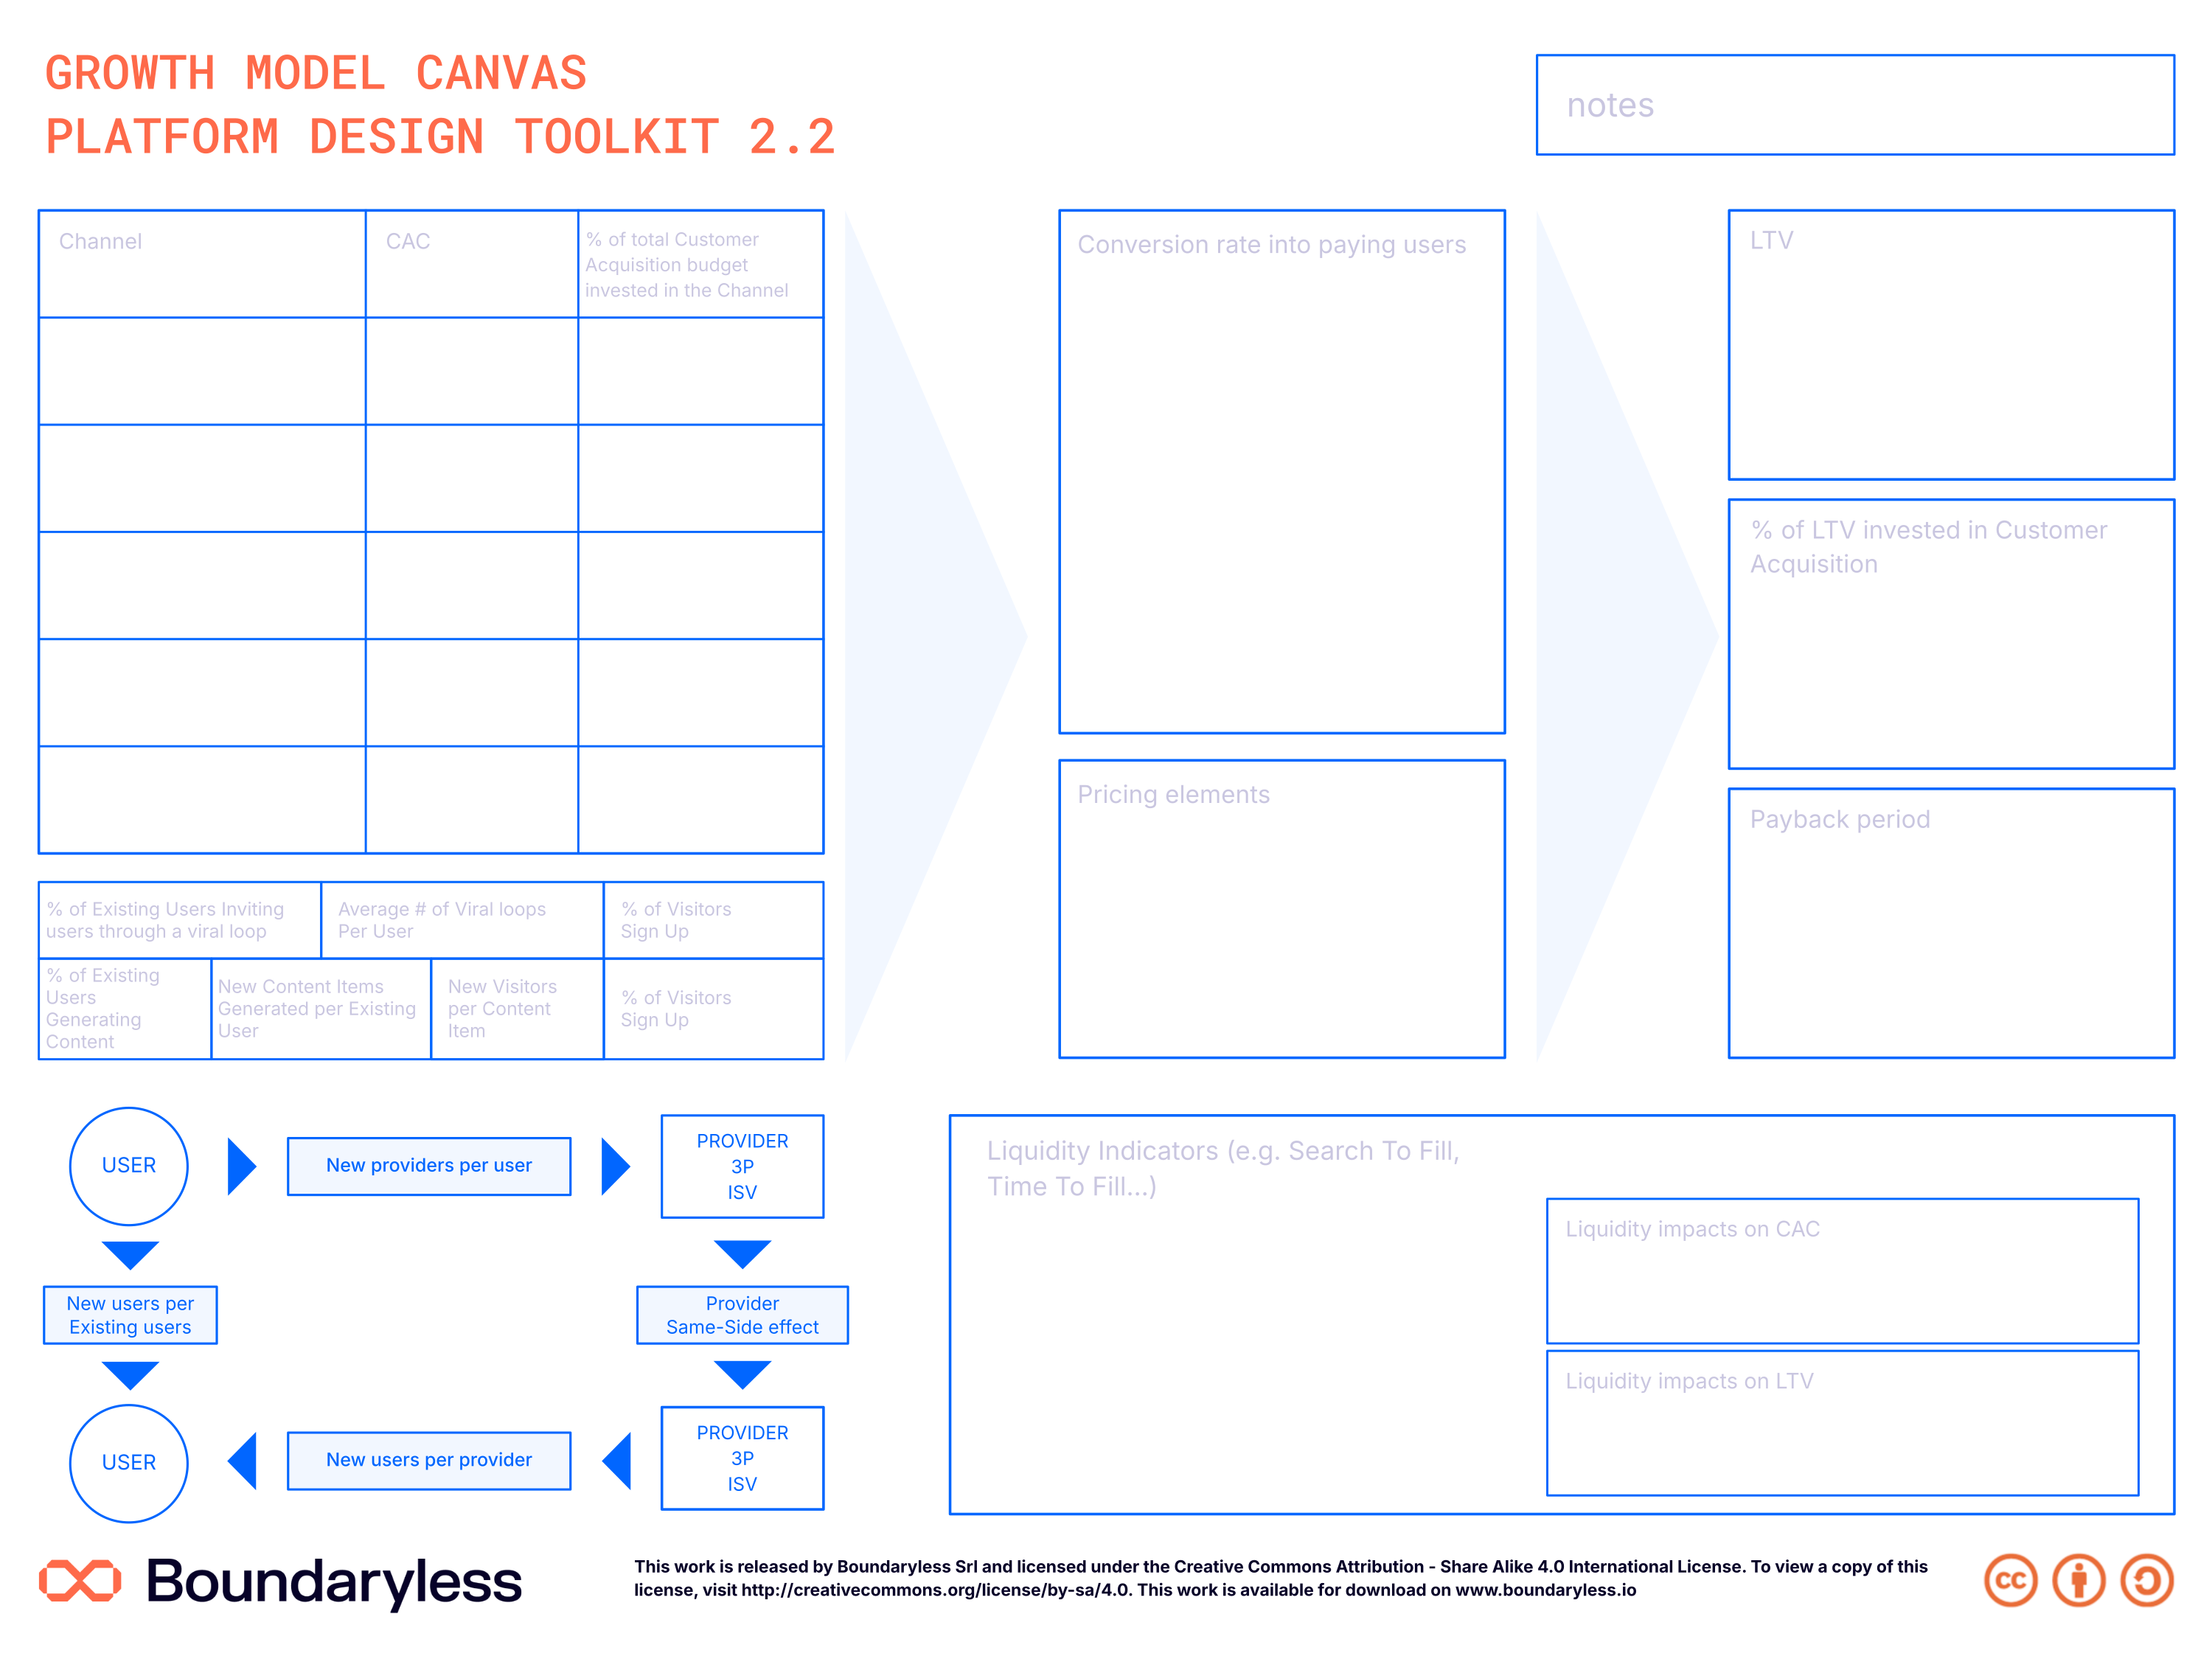
The canvas in the updated Boundaryless brand (full resolution — click to zoom). A print-ready PDF and editable SVG are also available on request.
Sections of the canvas
The canvas is organized in four interlocking quadrants.
1. Active loops
For each active growth loop (viral, paid marketing, content, sales — see Growth Loops), capture:
- The loop equation linking next-period users to this-period activity
- The conversion rate at each step
- The cycle time
- The bottleneck step
- The expected horizon for the loop to compound meaningfully
2. Cohort progression
The canvas tracks user cohorts as they progress through states:
- New — acquired in the period
- Activated — completed the first transaction (this is the threshold from "tried" to "real user")
- Active — transacting in the period
- Churned — no transaction in N periods
Each cohort retains differently. The canvas surfaces the cohort retention curve, which is what aggregate retention hides.
3. Unit economics
Per period and per cohort, the canvas captures:
- Transactions per active user
- GMV per period (delivered, post-cancellations)
- Net Revenues (from take rate + subscriptions + listing fees)
- Variable costs per transaction
- Contribution margin
- Fully loaded CAC by acquisition channel
- Cohort LTV
The textbook benchmarks (Fabrice Grinda) show up here: fully loaded CAC recouped in 6 months, 3× in 18 months, with decreasing CAC trend over time as network effects compound.
4. Sensitivity & scenarios
The bottom section captures:
- The 3–5 levers with the largest impact on outputs
- Bear / Base / Bull scenarios with internally coherent assumption sets
- The breakeven point and the gating assumption that drives it
How to use it
- Map each loop to its formula — write the equation that connects this-period activity to next-period new users
- Build the cohort accounting — explicit progression through states
- Layer in unit economics — per period and per cohort, never aggregate-only
- Sensitize the levers — find the 3–5 with the biggest impact
- Build 3 scenarios — Bear, Base, Bull, each internally coherent
- Identify the breakeven gate — the assumption whose validation matters most
Detailed walk-through in the Growth Model technique page.
Connections with other canvases
Inputs
- Flywheel Sketching Canvas — defensibility framing of the loops
- Network Properties Canvas — properties shape what loops are realistic
- Liquidity Canvas — the canonical unit and thresholds become inputs to the model
Outputs / paired with
- Learning Engine Canvas — feedback loops back into product behavior
- Platform Experience Canvas — bottleneck steps in the loops point to experience improvements
Used in techniques
- Growth Model — the operational technique for building the canvas + spreadsheet
- Growth Loops — provides the loop equations
- Choosing Metrics — provides the input/output metric variables
Used in pipelines
- Achieving Growth — Phase 3
Related reading
- Key Metrics for Platform-Marketplaces — the canonical Boundaryless essay on metrics
- Seek Growth and Evolve your Platform Strategy — guide release announcement
- The PDT Growth & Product Guide — chapter "Building a Growth Engine: the Growth Model" in Legacy PDT Growth
Status: draft · Toolkit: Platform Design Toolkit (Growth block)