Restructuring the Portfolio
Map customer needs, offerings, go-to-market and organizational capabilities in one picture, then realign the portfolio and the operating model around it
The macro-problem: When an organization grows into a portfolio of products and services — across multiple segments, channels, and internal capabilities — overlaps, redundancies, and unowned customer needs accumulate. This consists of mapping the whole organization as a portfolio (customer ecosystem → needs → go-to-market → offerings → organizational elements) so you can realign what you sell and how you organize to deliver it at the same time.
Overview
This is the fifth pipeline, and the junction between platform/product strategy and organizational design. It's the operational form of the Portfolio Map Canvas Application Guide v0.1 — a tool refined over two years of customer work that helps organizations align product offerings, GTM strategies, and internal capabilities in a single map.
The Portfolio Map evolved from Wardley Mapping principles, Domain-Driven Design (DDD), and the 3EO Toolkit — the platform-organization framework inspired by Haier's Rendanheyi and co-created with the Haier Model Institute. It treats the organization as a portfolio: leading organizations have moved beyond functional or matrix structures toward entrepreneurial operating models built around product units, supported by internal platforms acting as shared services or modular technologies — multiple connected yet independent value propositions serving diverse niche markets rather than one-size-fits-all solutions.
Within weeks of use, product teams spot overlaps to merge or bundle, sales teams discover cross-selling pathways, and operations leaders consolidate shared services to reduce overhead. The Canvas reveals blind spots in customer-needs coverage before competitors exploit them.
The work has a dual focus. Externally it optimizes customer-facing aspects — the products and services built, the go-to-market strategy. Internally it aligns organizational elements — capabilities, agreements, and decision-making structures — to improve efficiency and autonomy. Both lenses read the same map.
The key questions you need to answer
- How valuable are the customer needs we cover, and where are the biggest gaps or emerging opportunities?
- How are our products and services categorized — do they reflect customer needs, and which bundles create lock-in?
- Are our go-to-market strategies aligned with our segments, and over-dependent on high-touch motions?
- Do the mapped teams, capabilities, and units reflect coherent domain boundaries — and if not, how should they be reorganized?
- How should P&L and Total Cost of Ownership be framed across units, and which agreements (SLAs, EMC contracts) align dependencies toward market-facing outcomes?
When you work on this
When the organization is navigating a complex portfolio and product strategy and traditional hierarchical or matrix structures are too rigid. The guide identifies six recurring contexts: expanding multi-product / multi-segment strategies; lack of strategic alignment in portfolio governance (overlapping, redundant, conflicting offerings); transitioning from functional silos to product-centric models; post-M&A or private-equity-led restructuring; struggling with go-to-market and scaling bottlenecks; and building an ecosystem-centric organization. Growth or organizational tensions surfaced by the other pipelines typically lead here.
The flow
Four techniques compose this pipeline. Techniques 2 and 3 are the dual focus — the market-facing and the organizational lens on the same baseline map.
1 · Collect the Portfolio Data and Draft the Map
Technique: Collecting Portfolio Data · Canvas: Portfolio Map
Before plotting anything, conduct stakeholder interviews to determine capability providers, duplicated internal services, and unmet customer needs. Interview those closest to products and capabilities: Product Owners (target audience, features, roadmap), functional or domain leads / heads of product units (recurring challenges and bottlenecks), shared-service or platform managers (the bird's-eye view of who relies on cross-cutting services), and sales / business development (how offerings are actually bundled and sold, not how they're "supposed" to be).
Focus the interviews on who consumes each team's services and who they consume from, internally and externally. Where a boundary is fuzzy or two teams both think they "own" the same deliverable, you've found an overlap or a poorly defined domain. Pin down repeated complaints ("we can't move forward until Team X signs off") — these reveal ghost dependencies: unofficial handoffs the organization never recognized.
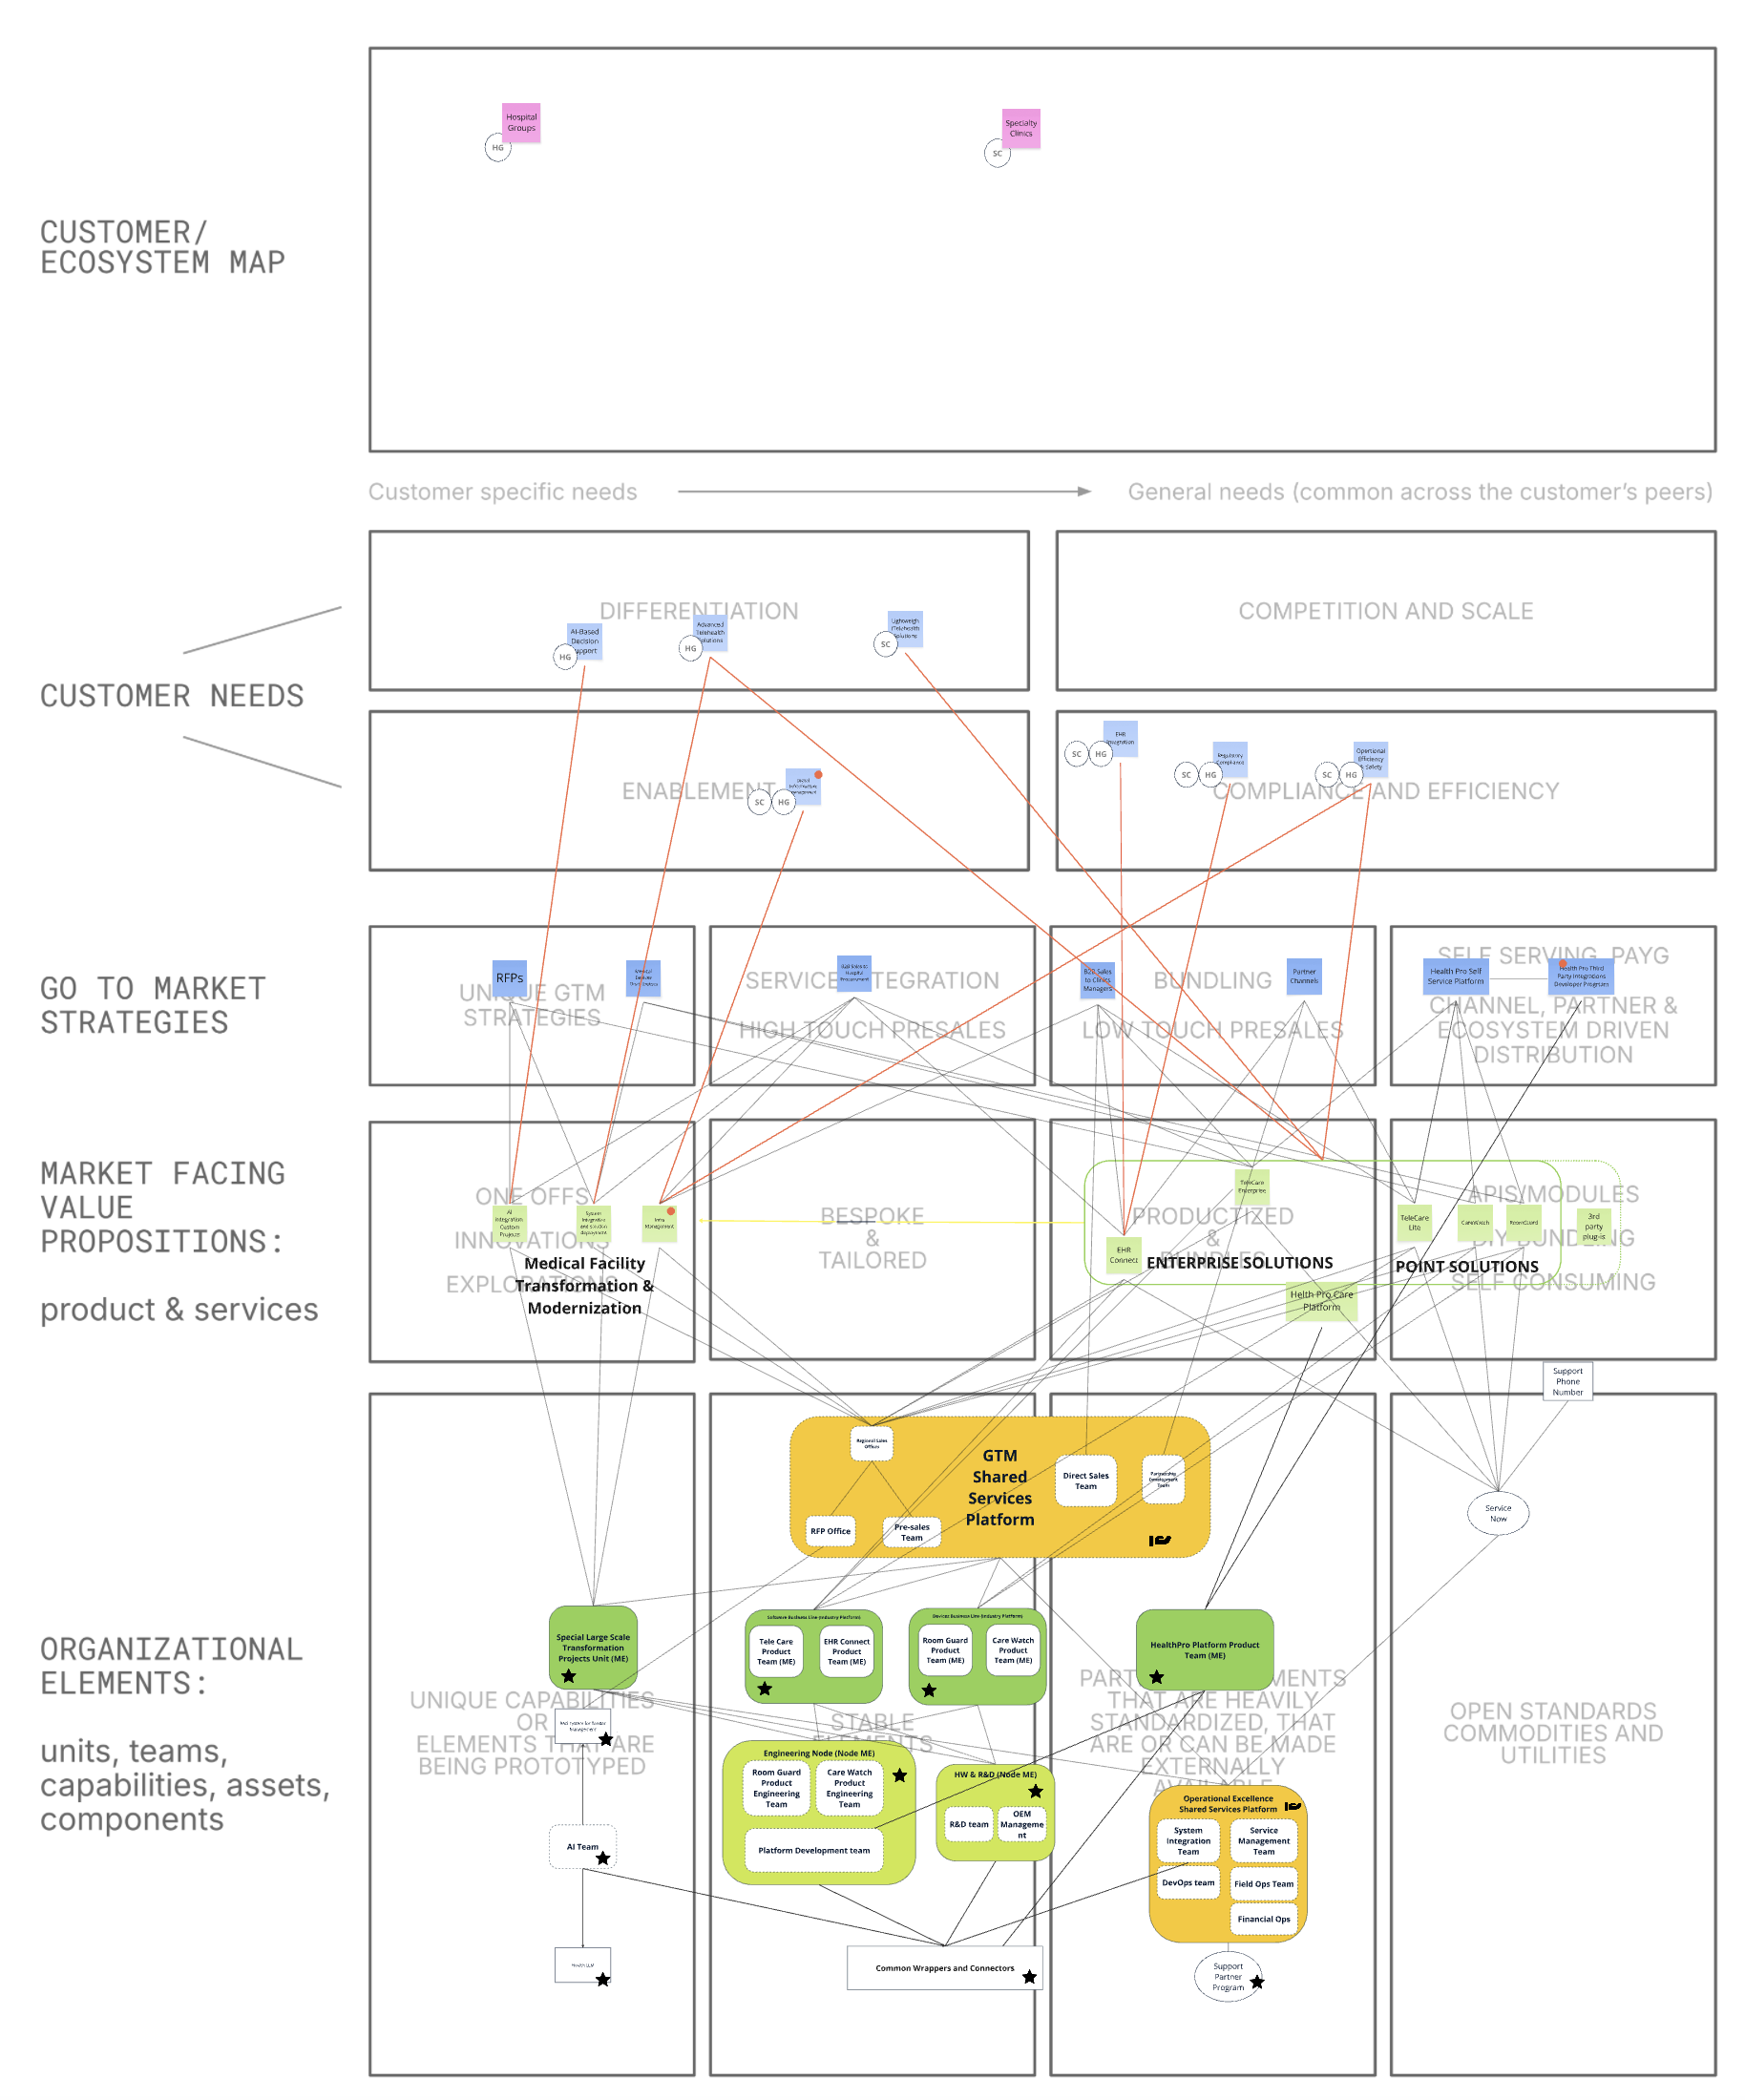
Then draft a preliminary map top-down: represent the customer ecosystem, place key customer needs in the four quadrants, cascade down to go-to-market channels, products and services, and finally the organizational elements that enable delivery. Tag pain points and hot spots as you go. Validate iteratively with the relevant teams — placement is sensitive (nobody likes being labelled "supporting" or "commoditized"), so emphasise the analysis is not judgmental and benefits the whole organization.
Implications & dependencies: no hard prerequisite, but stakeholder access across roles is essential — the whole pipeline depends on grounding the map in how the organization actually operates, not how leadership thinks it does. An Ecosystem Scan or Canvas from a prior Understanding the Ecosystem engagement gives a stronger customer-ecosystem layer.
2 · Analyze the Market-Facing Portfolio
Technique: Analyzing the Market-Facing Portfolio · Canvas: Portfolio Map (upper layers)
With a baseline map in place, apply the customer-facing lens. The Customer Needs layer is read across two axes — horizontal maturity (specific/bespoke ← → shared/commoditized) and vertical impact on the customer's value proposition (differentiation ← → operational) — yielding four zones: Differentiation (top-left, unique high-value needs), Competition & Scale (top-right, shared needs that sustain the customer's competitiveness), Enablement (bottom-left, contextual operational readiness), and Efficiency & Compliance (bottom-right, mature commoditized or regulatory needs).
This part of the analysis serves three objectives:
- Revise market-needs coverage and positioning — how valuable are the needs we cover, are needs balanced across quadrants, what high-value or emerging needs are unaddressed? Track recurring requests to anticipate future demand.
- Define a product taxonomy and bundling strategy — how are products categorized, which bundles create stronger value propositions and customer lock-in, can we increase the "systematicity" of what we provide and make certain products a control point?
- Refine the go-to-market strategies — are GTM motions aligned with segment needs, is the strategy over-dependent on high-touch approaches and in need of scalable channels (distribution partnerships, product-led motions)?
Beyond these fundamentals, a set of advanced heuristics extends the analysis, and even a quick pass yields quick wins: bundling complementary solutions, consolidating overlapping offerings, repositioning to fill gaps.
Implications & dependencies: requires the validated baseline map from technique 1. The map provides a high-level glance (are needs balanced across quadrants?) but a deeper per-need evaluation of premium, market size, willingness to pay, and growth potential is usually necessary.
3 · Analyze the Organizational Elements
Technique: Analyzing Organizational Elements · Canvas: Portfolio Map (lower layers)
Now focus on the organizational structure powering the portfolio. The objective is to improve domain consistency — keeping together capabilities coherent from a workflow and value-proposition perspective — while reducing coordination needs, minimizing dependencies, and clarifying responsibilities. Inconsistent domains cause ghost overlaps and unclear decision authority; clear boundaries keep teams focused and agile.
Start with domain re-bundling: identify emergent coherent domains — clusters of capabilities that naturally align and could be restructured into a redefined unit — and cross-enabling services (compliance, legal, HR, but also software, data science, AI capability hubs). Then apply the 3EO / Platform Organization topology: Core Domains map to Micro-Enterprises and Modular Technology Platforms (Node-MEs) that drive differentiated value; Supporting Domains become Shared Service Platforms consolidating reusable capabilities; Generic Domains are handled by standardized SSPs or external providers. Even without adopting the full topology, the map reveals where common services could be centralized or where market-facing teams could gain autonomy as product lines/units.
Finally, frame dependencies, P&L, and TCO. MEs manage their own P&L; SSPs keep transparent, traceable operating costs. Where a value proposition depends on an organizational element, the consumer unit should encompass it in the same P&L, contribute via a 1-to-1 SLA, or build a win-win Ecosystem Micro-Community (EMC) contract that aligns all dependencies toward market-facing outcomes with real skin in the game (Solution EMCs, Experience EMCs, GTM agreements). Targeted quick wins apply even without a full reorg: merge overlapping capabilities, reassign fragmented domains, introduce a mini-P&L or simple SLA, pilot an EMC-like approach on one project.
Implications & dependencies: reads the same baseline map as technique 2, from the bottom up. The platform-org topology resonates strongly with a DDD reading of the organization, but the principles apply to traditional and hybrid models too.
4 · Implement the Portfolio Strategy
Technique: Implementing the Portfolio Strategy · Canvas: Portfolio Map (synthesis)
The insights operationalize incrementally — never all-or-nothing. The first outcome is a clearer portfolio strategy: where to explore and innovate (coverage gaps and opportunities), what to discontinue (inefficiencies and value-less products), and which core control points to prioritize. The second is a defined or updated product taxonomy that sharpens customer communication, value-escalation pathways, and bundling.
The third is improving the operating model — redefining the organizational topology as an evolution of the existing structure (e.g. functional → platform organization) or a refinement of the current one: clarifying P&L structures, identifying TCO for every offering, reducing inter-unit dependencies, and establishing win-win contracts and interaction models between units. By the end you have a new organizational sketchbook — structural adjustments and guidelines — which must evolve into a playbook: tested, agreed policies that empower units with autonomy inside a structured framework.
For implementation, follow an incremental, experimental approach: run pilots as "spotlights" — controlled, self-contained domains where a subset of teams experiments with new structures before broader adoption. Prioritise pilots on two factors: learning potential (how much it validates assumptions about the long-term vision) and organizational sustainability (how easily a relevant part of the playbook can be adopted without disrupting operations).
Implications & dependencies: the culmination of the dual analysis — requires both the market-facing (technique 2) and organizational (technique 3) reads. Changes apply incrementally and in alignment with existing constraints; the playbook evolves through piloting.
What comes next
The portfolio strategy and the new operating model feed an implementation playbook validated through pilots — and the work is circular. Restructuring often surfaces fresh ecosystem and value-proposition questions, looping back to Understanding the Ecosystem; a leaner, better-owned portfolio sharpens the growth work in Engineering Sustainable Growth. As the bridge into the organizational-design line, it continues directly into Adopting Distributed P&L — giving the newly-bounded units financial autonomy — and Launching Initiatives in a Distributed Organization. Treat the Portfolio Map as a living artifact, revisited as the organization and its markets evolve.
Source
This pipeline is the operational form of the Portfolio Map Canvas Application Guide v0.1 (Boundaryless), integrating Wardley Mapping, Domain-Driven Design, and the 3EO platform-organization framework co-created with the Haier Model Institute. Full legacy narrative: Legacy Portfolio Map Guide.
Pipeline type: macro_problem · Status: active